
Categories
buyer, seller, RetireesPublished July 14, 2026
Bryan-College Station home values: the 2026 market update

Bryan-College Station home values: the 2026 market update
If you're asking how have home values changed in Bryan College Station recently, the honest answer is: it depends on which street you're standing on. You've probably heard at least two contradictory things about the Bryan-College Station housing market lately. Prices are up. Prices are flat. Homes are sitting forever. The market is still competitive. All of these statements contain a slice of truth, which is exactly what makes mid-2026 such a confusing moment to be a buyer, a seller, or a homeowner quietly watching your equity.
The BCS market is not crashing. It is also not the sprint it was in 2021 and 2022. What it is doing is settling into a deliberate pace where local knowledge and accurate pricing matter far more than momentum. Debi Stoll of DoorStep Home Group at Keller Williams Brazos Valley has tracked this market through multiple cycles, and the data-backed picture she sees on the ground is more useful than any national headline.
This article pulls from the FRED All-Transactions House Price Index, Zillow, local MLS data, and demographic research on Texas A&M to give you real numbers, explained plainly, whether you're buying, selling, or simply keeping score on your home's worth.
How have home values changed in Bryan College Station recently: 2026 data
The first thing to understand is that Bryan and College Station are two distinct submarkets operating inside the same metro. Lumping them together produces an average that accurately describes neither city. Bryan tends to attract first-time buyers and investors drawn to lower price points, while College Station skews toward faculty, professionals, and move-up buyers tied to the Texas A&M corridor. When you see a single "BCS median price," check whether the source is separating the two cities or blending them.
Median sale prices, how home values changed in Bryan College Station recently
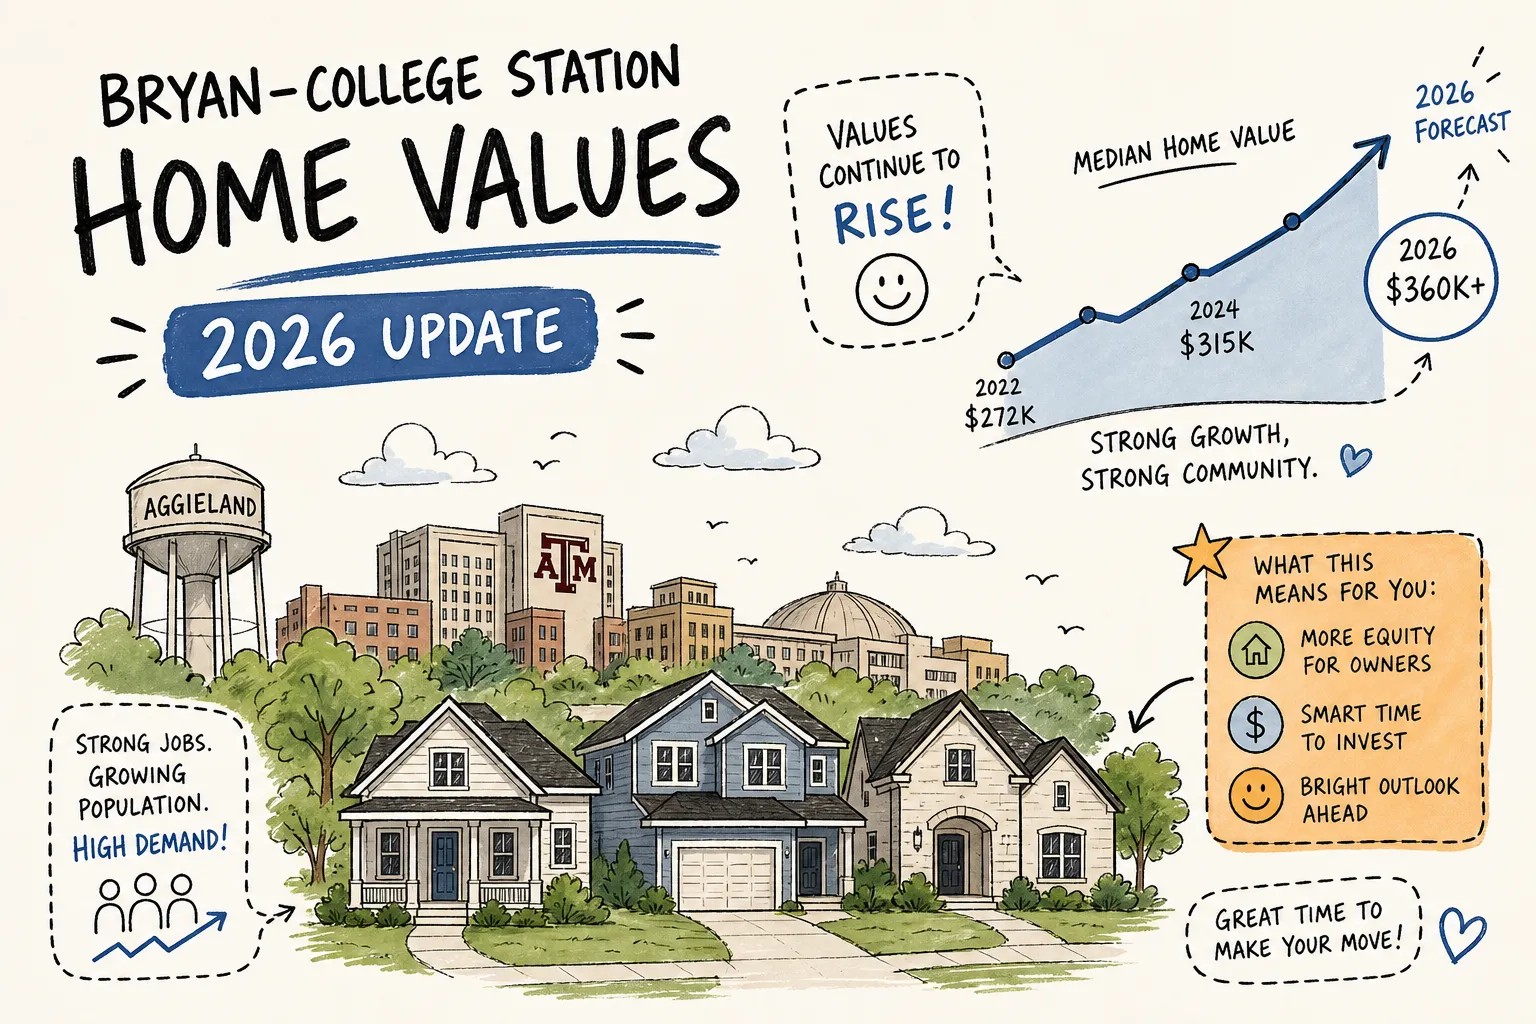
The Bryan median sale price sits at approximately $300,000 as of May 2026 (per local MLS data), essentially flat compared to the same period a year ago. College Station carries a higher average home value of $343,155 according to Zillow, reflecting its concentration of newer construction, proximity to Texas A&M, and stronger demand from faculty and professional buyers. The gap between the two cities has widened slightly in recent years, making Bryan an increasingly attractive entry point for first-time buyers priced out of the College Station market.
What the FRED house price index reveals about the Brazos County market
The most reliable long-view tool for this market is the FRED All-Transactions House Price Index for the College Station-Bryan MSA (FHFA series, updated May 26, 2026). For Q1 2026, the index reads 396.92, up from 384.18 in Q1 2025, a gain of 3.3% year-over-year. This index tracks repeat-sale transactions on the same properties over time, which filters out the noise of changing home sizes or quality mix. It confirms the market has held its value. To put that in perspective, the same index climbed roughly 30% between Q1 2020 and Q1 2022 during the pandemic run-up; the current 3.3% annual pace is a fraction of that pace, which is why "the market is stable" and "the market has slowed" can both be accurate at the same time.
The gap between listing price and final sale price
Here is the number most buyers and sellers miss. The median listing price in BCS is $326,300. The median sold price is approximately $300,000 (Brazos Valley MLS aggregate, May 2026). That spread of roughly $26,000 tells a clear story: seller expectations are running ahead of what buyers are actually willing to pay. A listing price is not a sale price. For buyers, this gap signals room to negotiate. For sellers, it is a warning that optimistic pricing does not automatically translate into optimistic results.
Inventory and market tempo: reading the BCS signals
Price data tells you where the market has been. Inventory data tells you where it is going. The supply-side numbers in BCS right now represent the most meaningful shift in the market since the frenzy years, and they deserve a closer look.
Active listings and months of inventory in Bryan TX
Active listings reached approximately 1,375 homes in April 2026, up from 1,206 in December 2025 and continuing a steady climb since late 2024 (Brazos Valley Association of Realtors monthly report). Months of inventory now sits between 4.4 and 4.8 months. A balanced market, by conventional definition, is six months of supply. At 4.4 to 4.8 months, BCS is not a full buyer's market, but it is leaning that direction more clearly than at any point in the past several years. For comparison, months of supply in early 2021 hovered below two months, and homes were routinely under contract within a week of listing. Buyers have real options now. That kind of choice simply did not exist in 2021.
Days on market as a negotiation signal
Median days on market are running between 75 and 80 days, Redfin's May 2026 data puts College Station specifically at 76 days. Homes are sitting considerably longer than during the 2021-22 boom, when many properties sold within days of hitting the market. This single metric shifts negotiating leverage more than almost any other. A home that has been listed for 90 days carries a very different conversation than one listed last week. Buyers who track days on market before writing an offer gain a concrete advantage. Sellers who ignore this number tend to learn an expensive lesson.
The local forces driving demand in the BCS market
Price and inventory data only tell part of the story. Two structural forces are actively shaping BCS demand in 2026, and understanding both helps buyers and sellers make smarter decisions.
Texas A&M's enrollment pause and its housing ripple effect
In January 2025, Texas A&M University announced a pause on undergraduate enrollment growth at its College Station campus, capping new undergraduate enrollments at 15,000 annually and committing to add 2,500 new on-campus beds. (The university's official announcement and subsequent coverage in the Bryan-Eagle detail the policy terms.) For context, the previous decade saw roughly 30% growth in total enrollment, and that expansion was a direct engine of housing demand, rental prices, and investor activity across the metro.
The enrollment pause does not kill demand. It moderates the pace of demand growth. Graduate enrollment actually increased by roughly 10%, approximately 857 students, in Fall 2025 (Texas A&M Office of Institutional Research), sustaining off-campus rental and ownership demand from a population that typically prefers longer leases and independent living. The net effect is a market that remains active and fundamentally sound, but no longer has the enrollment-driven tailwind that powered rapid price appreciation in the prior decade.
Interest rates and how they're filtering buyers
Thirty-year fixed mortgage rates in Texas currently range from 6.43% to 6.75%, depending on the lender and borrower profile (Bankrate, July 2026). That is down roughly 27 basis points from a year ago, a modest improvement that has not yet meaningfully expanded the buyer pool. Elevated rates continue to reduce the number of qualified buyers relative to the 2020 and 2021 environment when rates sat below 3%. This keeps demand volume tempered and reinforces the flat-to-modest price growth the data confirms. The buyers active in this market are serious and financially prepared; the casual or marginal buyers have stepped back.
What buyers should know before making an offer in BCS
The data paints a picture of real opportunity for prepared buyers. The BCS market is not distressed and it won't give homes away, but the leverage balance has shifted in your favor compared to two years ago.
Using inventory conditions to your advantage
With 4.4 to 4.8 months of supply and homes sitting 75 to 80 days on average, you have negotiating room that simply did not exist in 2022. The listing-to-sale-price gap of approximately $26,000 confirms that many sellers are adjusting their expectations at the offer table. On homes with meaningful time on market, offering below ask is not an insult, it is reading the data correctly. Work with an agent who can pull the full price history and days on market before you write the number.
What to watch in the second half of 2026
The BCS market follows a pattern tied closely to the Texas A&M academic calendar. Sales volume historically peaks in July, driven by student move-ins, faculty relocations, and families closing before the fall semester. Listing activity tends to accelerate again in late January and February. If active listings continue rising through mid-2026, buyer conditions may improve further heading into fall, when casual lookers clear out and remaining inventory faces less competition from new listings. Buyers who are ready to move in late summer or early fall may find the most favorable negotiating environment of the year.
What sellers need to do before they list in 2026
The flat-to-modest price environment rewards sellers who price precisely and present their homes well. It punishes those anchoring to 2022 peak values and expecting the market to meet them there.
Why pricing discipline matters more now than it did in 2022
When homes were selling in days, an overpriced listing still generated activity because buyer urgency filled the gap. With homes now averaging 75 to 80 days on market, that urgency is gone. An overpriced listing goes stale. A stale listing signals weakness to buyers, who then use the price reduction history as leverage to push the final number below what a correctly priced home would have achieved at launch. The compounding cost of starting too high is real, and in this market, it's measurable.
Getting an accurate local estimate before you list
National platforms like Zillow produce automated estimates based on broad algorithms, their own methodology documentation acknowledges that Zestimates carry a median error rate that can widen significantly in lower-turnover neighborhoods. They do not account for the block-level differences in BCS neighborhoods, school zoning variations, proximity to campus, or the specific buyer pool for your price point and property type. Before you settle on a list price, you need a neighborhood-level comparative market analysis built on actual recent sales from the local MLS, not a national platform's model.
DoorStep Home Group offers a free home value estimate tool on their website that gives BCS homeowners a neighborhood-level read before committing to a listing conversation. Debi Stoll brings granular Brazos County market knowledge to that analysis, the kind of street-by-street context that automated tools consistently miss. It's a practical first step grounded in real local data.
Where the BCS market stands: a clear-eyed summary
So how have home values changed in Bryan College Station recently? The short answer: they've held steady, not surged. The FRED index's 3.3% year-over-year gain confirms the market has maintained its value. The 4.4 to 4.8 months of inventory and 75 to 80 median days on market confirm that buyers have regained leverage they didn't have during the peak years. Prices are not collapsing; they are recalibrating around realistic buyer purchasing power and a moderated demand environment shaped by the enrollment pause and elevated mortgage rates.
National headlines rarely capture what's happening street by street in BCS. The College Station home in a top school zone close to campus behaves differently than the Bryan starter home two miles from the highway. These distinctions matter when you're making a six-figure decision, and they only become visible through local expertise and current MLS data.
Whether you're actively buying, preparing to sell, or simply tracking your equity, Debi Stoll and DoorStep Home Group at Keller Williams Brazos Valley can give you a market analysis grounded in the actual numbers from your neighborhood. Start with the free home value tool at the DoorStep Home Group website, and reach out when you're ready for the full conversation.

Debi Stoll
| DoorStep Home Group | Keller Williams Brazos Valley
or another way